Cases of Intergroup Tensions and Conflicts in Malaysia
Background
This database was developed in response to escalating religio-political tensions surrounding Malaysia’s 2018 general election, aiming to quantify conflicts driven by racism and religious hatred at the national level that could have potential impact on social cohesion and national security.
The 2018 general election was a pivotal moment in Malaysia’s history, marking the country’s first change of government. The Pakatan Harapan (PH) coalition secured 121 parliamentary seats, ending Barisan Nasional’s (BN) 61-year rule, during which BN managed to win only 79 seats.
The post-2018 election period saw a surge in intergroup conflicts, leading the Fragile States Index to classify Malaysia in the ‘Warning’ category, with a score of 63.6 in 2018, improving slightly to 60.5 in 2019 but remaining in the same category. By 2020, Malaysia’s score further improved to 57.6, moving the country into the ‘Stable’ category. This upward trend continued through 2024, reaching 53.1, reflecting increased national stability.
Below is the chronology of key political events highlighting Malaysia’s peaceful democratic transitions. However, they have also heightened intergroup tensions, as race and religion are frequently politicised, driving unrest both on the ground and online.
May 2018: 14th General Election (GE14)
Pakatan Harapan (PH), led by Mahathir Mohamad, won the general election, ending Barisan Nasional’s (BN) six-decade rule. The victory was largely attributed to public dissatisfaction with BN, particularly due to the 1MDB corruption scandal. When PH ruled, the opposition composed of UMNO BN and PAS and the Malay-Muslim network orchestrated many protests against PH’s attempts of reforms and other issues.
February 2020: ‘Sheraton Move’
A faction within PH defected and collaborated with opposition parties, including Bersatu, UMNO, and PAS, leading to the collapse of the PH government. Subsequently, Muhyiddin Yassin, president of the Malaysian United Indigenous Party (BERSATU), was appointed Prime Minister, heading the Perikatan Nasional (PN) coalition.
January 2021: Declaration of State of Emergency
The government declared a national state of emergency, citing the COVID-19 pandemic and ongoing political instability. This move suspended Parliament and elections until August 2021, allowing the administration to govern without legislative oversight. At the time, Malaysia faced a surge in COVID-19 cases and a strained healthcare system.
August 2021: Resignation and Appointment of a New Prime Minister
Muhyiddin Yassin resigned after losing majority support in Parliament, primarily due to UMNO’s withdrawal of backing. His resignation followed mounting public dissatisfaction over his administration’s handling of the COVID-19 pandemic, economic downturn, and prolonged emergency rule. Following his resignation, the Yang di-Pertuan Agong appointed him as caretaker Prime Minister until a successor was named.
Ismail Sabri Yaakob of UMNO was sworn in as Malaysia’s ninth Prime Minister, leading a coalition government consisting of Perikatan Nasional (PN), Barisan Nasional (BN), Gabungan Parti Sarawak (GPS), and Gabungan Rakyat Sabah (GRS). His tenure lasted until 10 October 2022, when Parliament was dissolved to pave the way for the 15th General Election (GE15).
November 2022: 15th General Election (GE15) and the ‘Green Wave’
The election resulted in a hung parliament, with no coalition securing a clear majority. After negotiations, Anwar Ibrahim of PH became Prime Minister after forming a unity government with the main political parties, BN, GPS, GRS and Warisan. The election also marked the rise of the ‘Green Wave,’ with PN, particularly PAS and Bersatu, dominating Terengganu, Kelantan, and Kedah. Several constituencies in mainland Penang also shifted to PN.
Additionally, geopolitical developments—particularly Hamas’ October 7, 2023, attack on southern Israel and Israel’s subsequent large-scale military invasion of Gaza—have had domestic political repercussions. Prime Minister Anwar Ibrahim reaffirmed Malaysia’s pro-Palestinian stance, condemned Israel’s occupation, and the conflict further fueled pro-Palestinian rallies and boycott movements against Israeli-linked businesses and allies within the country.
The lack of comprehensive data on such cases prompted the Initiative to Promote Tolerance and Prevent Violence (INITIATE.MY) to lead efforts in data collection and dissemination. The organisation categorises cases into four types: protests, violent clashes, vigilantism, and terrorism. By mapping these cases against political events and key indicators—such as geography, involved actors, and resolutions—INITIATE.MY adopts an evidence-based approach to understanding behaviours and actions linked to extremism and violence while supporting effective strategies to mitigate these threats.
Goal
To establish a data-driven initiative to document and visualise cases of tension and conflict driven by religious hatred and racism in Malaysia through interactive data visualisation.
Objectives
1. To analyse emerging trends including behaviours, actions, timeline and actors related to conflict and extremism fueled by racism and religious hatred in Malaysia, using evidence-based insights.
2. To stimulate public discourse, encourage further research, and drive policy action to address these concerning trends.
Range of data collection
From 1 January 2004 to 31 January 2025.
Target audience
Researchers, practitioners, and policymakers in security-related fields, including conflict studies, the prevention of extremism and counterterrorism.
Research team
Research lead
Aizat Shamsuddin, International Relations (UniMelb) & Law and Syariah (USIM)
Co-researchers
Hisham Muhaimi
Ahmad Muziru Idham (2023-2025)
Eow Shiang Yen
Kenneth Lim
Ain Nasiehah
Akwa Mahzan
Shaik Irfan
Falisya Aufiya
Hafeez Zainal
Data analysts
C. Hari S. Shankar
Aiman Zulkifar
Update & Accessibility
This database was last updated on 31 March 2025.
The raw dataset is available in .xlsx format upon request. Future data collection depends on funding availability.
For enquiries, please contact us at salam@initiate.my.
Research Methods
1. Media monitoring
A group of researchers utilised online tools such as ‘Google search and filters’, ‘Wayback Machine’, etc. using relevant keywords to find and retrieve reported news or information that match the research guidelines.
2. Peer review
Researchers reviewed the dataset line by line and column by column to verify its accuracy, relevance, and reliability. They provided feedback, and the research team made revisions or corrections where necessary.
3. Focused group discussion
Researchers and practitioners held internal and external discussions periodically to review the dataset and its visualisations. These sessions helped identify trends, assess risks, propose recommendations to address alarming trends, and suggest improvements to enhance user experience.
Research limitations
This study has several limitations that may affect the comprehensiveness of the findings.
1. Scope of cases
This study only includes cases of protests, violent clashes, vigilantism, and terrorism that were motivated by racism and religious hatred. The focus is limited to incidents that were officially reported in the media. As a result, cases that were unreported or underreported may not be captured in the dataset.
2. Gaps in case details
The study faces challenges in obtaining complete information on certain cases, particularly regarding the identity and affiliations of primary actors. In many instances, there is a lack of follow-up reporting on case developments, legal proceedings, or resolutions, making it difficult to track long-term outcomes.
3. Data verification challenges
The primary sources of data for this study are media reports, which may contain biases or provide incomplete narratives. To enhance accuracy, multiple news sources were cross-referenced. Additionally, where media reports were insufficient, supplementary information was gathered from non-media sources, including social media posts, to provide a more comprehensive understanding of each case.
Needs assessments
1. Comparative analysis
Cross-reference findings with existing data from ACLED, the Royal Malaysia Police (RMP) or PDRM, and the Ministry of National Unity, with the latter two maintaining state- and district-level records. This can enhance micro-level research beyond national-level incidents and media-reported cases.
2. In-depth case studies
Conduct detailed investigations into specific cases, examining their chronologies and developments to strengthen evidence-based advocacy strategies. This approach enables a clearer assessment of severity and necessary actions to address threats to social cohesion and national security.
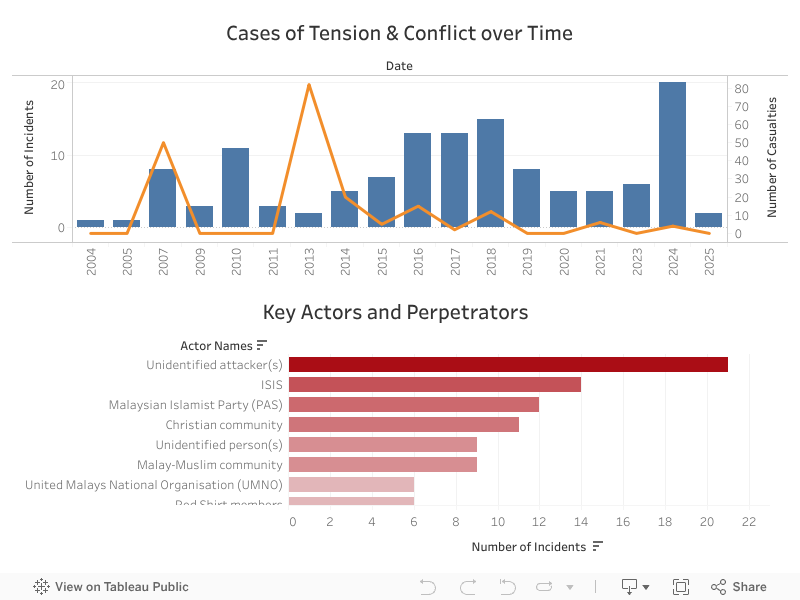
The database documents cases of protests, violent clashes, vigilantism, and terrorism driven by racism and religious hatred. Below is an overview based on the data collected.
Protests
Protests in Malaysia range from small to large-scale peaceful demonstrations, primarily organised to oppose policy reforms or respond to domestic and geopolitical issues related to race and religion. These protests often seek to assert the perceived superiority of a particular race or protect the sanctity of a specific religion. These demonstrations are typically led by partisan groups and NGOs that align based on shared political interests. The rise of such protests is largely driven by the politicisation of race and religion, often fueled by fear-mongering and concerns over equal socioeconomic rights.
Examples include protests against the admission of non-Bumiputera students into UiTM, the anti-ICERD rally at Dataran Merdeka in August 2018, the #BuyMuslimFirst campaign launched online in March 2019, and two #SaveSyariah rallies held in Putrajaya in November 2023 and February 2024.
Violent clashes
Violent clashes typically involve confrontations between opposing groups over race- or religion-related local issues. These incidents are often instigated, organised, or mobilised—sometimes by hired individuals—to express dissatisfaction, leading to physical violence. In many cases, authorities such as police or firefighters, who attempted to de-escalate the situation, also became targets. While clashes may appear to be driven by racial or religious divisions, they are often manipulated and exploited by actors with vested political and economic interests.
Examples include the Seafield Temple incident in Subang in November 2018, which originated from a land dispute and led to the death of a firefighter, and the confrontation in Cheras in September 2021, where members of the Buddhist community clashed with authorities over the reported removal of a temple
Vigilantism
Vigilante actions are often carried out by individuals or groups acting as self-appointed enforcers of moral values with coercion and or violence. These actions, whether organised or spontaneous, typically target individuals perceived to have violated societal norms, particularly those tied to Islamic values in Malaysia. Such incidents often occur in homogeneous communities, where enforcing majority-held beliefs is easier. These actions, which involve unlawful raids and detentions, are illegal under Malaysian law. However, the rise in vigilantism may stem from growing distrust in religious institutions’ ability to regulate moral conduct, alongside increasing extremism within certain communities.
Examples include unidentified men who harassed and vandalised Israeli-linked businesses such as McDonald’s in Kuantan, Tawau, and Sungai Petani in April 2024, and Starbucks in Tawau during the same month. In Sungai Petani, a group known as Skuad Badar conducted illegal raids on budget hotels to target unmarried Muslim couples and raids on a cyber cafe to target youths who skipped the Friday prayer in November 2017, November 2018, January 2021, and January 2023. In April 2020, a neighbourhood group removed alcohol from a Jaya Grocer outlet. In November 2021, a group of FoodPanda riders in Petaling assaulted a boy for allegedly insulting Islam.
Terrorism
Terrorism threats in Malaysia stem from both domestic dynamics and geopolitical developments. Although successful attacks remain rare, our database captures a broader range of terrorism-related incidents. These include political violence targeting places of worship and business premises during periods of heightened racial and religious tension, foiled terror plots, and offences such as disseminating extremist materials, participating in terror networks, and activities by foreign agents that undermine national security.
Examples include the IS-linked lone-wolf attack on the Ulu Tiram police station in May 2024, which resulted in the deaths of two police officers and the attacker; a series of Molotov cocktail attacks on boycotted KK Mart outlets in Batu Pahat, Kuantan, and Kuching in March 2024; a foiled terrorism plot targeting Seafield Temple in May 2019, reportedly in retaliation for the 2018 violent clash at the same site that led to the death of firefighter Muhammad Adib; and 10 successful and attempted Molotov cocktail attacks in January 2010 linked to the Kalimah Allah controversy across various locations in Malaysia.
Four types of events namely protest, violent clash, vigilantism and terrorism are collated in the database by using only two indicators of motivation namely religious hatred or racism.
1) Indicators
Religious hatred
Hostility or prejudice directed at individuals or groups based on their religious beliefs or lack thereof, expressed through discriminatory language, behaviour, or actions.
Racism
The belief in the superiority of one race, ethnicity, or nationality over another, manifested through discriminatory language, behaviour, or actions.
2) Types of event
Protest
Protests are organised expressions of support or opposition to specific issues, policies, or events, carried out either online or offline. They may take the form of physical gatherings, marches, or digital campaigns, and are often driven by social, political, or cultural concerns.
Violent clash
Violent clashes are confrontations between opposing groups or individuals that escalate into physical violence, either spontaneously or through premeditated actions. These incidents often arise from social, racial, or religious tensions and may be driven or manipulated by political or economic interests.
Vigilantism
Vigilantism refers to acts of enforcement, coercion, or violence carried out by individuals or groups often without legal authority, in an attempt to impose moral or social order, punish perceived wrongdoers, or seek justice. These actions can be organised or spontaneous and are typically driven by community grievances, politicised sentiments, or religious and racial tensions.
Terrorism
Terrorism refers to acts or threats of violence carried out by individuals or groups—whether organised or acting alone—with the intent to instil fear or cause harm in pursuit of political, ideological, or religious goals. Perpetrators may be affiliated with sanctioned terrorist organisations, ideologically influenced lone actors, or foreign operatives involved in activities that undermine national security.
3) Types of actors
Primary actors
Key individuals, groups, or entities directly involved in a conflict or tension—whether as instigators, opponents, or victims. They play a central role in initiating, escalating, de-escalating, or resolving the situation. Based on our database, this category typically includes leaders of political parties, NGOs, religious institutions, and PDRM.
Associate actors
Secondary or indirect individuals, groups, or entities that influence a conflict or tension but are not at the forefront. They may contribute to escalating or diffusing the situation or be secondarily impacted by it. Their actions, affiliations, or influence can shape the trajectory of the conflict. Based on our database, this category typically includes followers of political parties or NGOs, as well as faith-based or residential communities.
4) Interaction
1) Government/Security Forces
State actors that include the government ministries, bodies and agencies of Malaysia.
2) Protesters
Individuals or groups who participate in a protest such as political parties, NGOs, followers, etc.
3) Terrorist individuals/groups
Individuals or groups who participate in a terrorist activity such as militants, lone-wolves, etc.
4) Vigilante individuals/groups
Individuals or groups who participate in a vigilante activity such as NGOs, community leaders, followers, etc.
5) Rioters
Individuals or groups who participate in a violent clash such as NGOs, followers, etc.
6) Civilians
Ordinary and unarmed members of society that include residents, devotees, bystanders etc.
7) External/Other Forces
State actors of foreign governments and international actors such as international bodies, foreign intelligence agencies and armed forces.
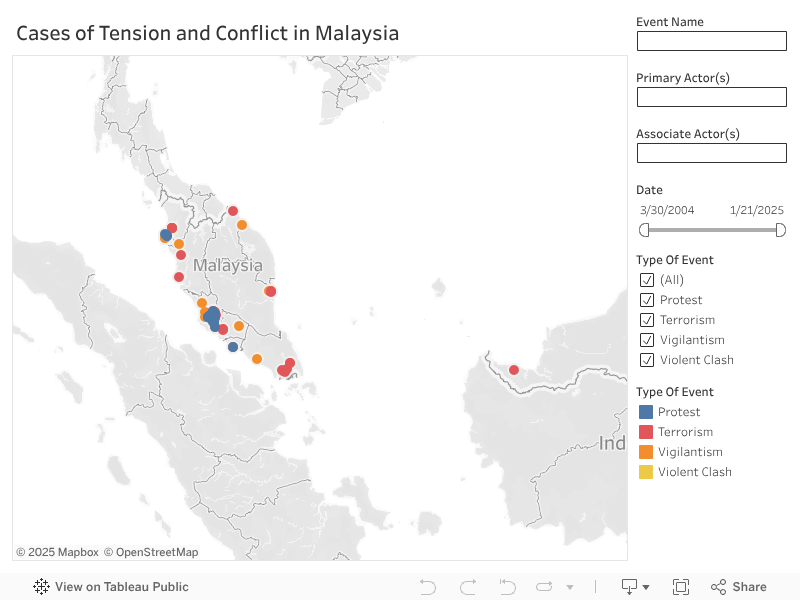
1. Overview – Database 2 is primarily displayed in the form of an interactive map. It allows zooming in and out, panning around and identifying specific features indicated in the dashboard filter on both sides of the map. If you are viewing from a mobile device, the dashboard filter will be at the bottom of the map.
a. The different color dots on the map differentiate the type of events:
i. Blue – protest
ii. Red – Terrorism
iii. Green – Vigilantism
iv. Orange – Violent Clash
b. A ‘tooltip’ will appear when you click on a respective dot. Each dot shows a single event according to their location on the map. The tooltip entails:
i. Source Name
ii. Event Type
iii. Date
iv. Primary Actor
v. Associate Actor
vi. Interaction
vii. Location
viii. Type of Government Involved
ix. Type of Consequence
x. Type of Solution
xi. Number of Injury
xii. Number of Death
xiii. Source Link
c. Compatibility
i. On web browsers
1. Chrome on Windows and Mac
2. Microsoft Edge on Windows
3. Mozilla Firefox & Firefox ESR on Windows and Mac
4. Apple Safari on Mac
ii. On mobile devices
1. Chrome on Android
2. Apple Safari on iOS 11.3 or later
3. Tableau Mobile iOS and Android Apps, available at the Apple App Store and Google Play Store, respectively
2. Navigating the map (desktop)
a. Moving the map
i. By using the map view toolbar: In the upper-left corner of the map view, the view toolbar lets you zoom in, zoom out, and return to the default view. Click on the ▶ button in the toolbar to pan to different areas of the map or highlight a custom selection of data points.
ii. By using your cursor: You may also click and drag your cursor to move around the map (adjust settings in the toolbar) and double click on the area that you want to focus on to zoom in.
b. Viewing the tooltip
i. Click on a respective dot to view the tooltip. Each dot shows a single event according to their location on the map. Some events may appear multiple times on the map. This indicates that they took place in more than one location.
c. Checking the source link
i. Step 1 – Hover your cursor over the desired event (dot)
ii. Step 2 – Click on the the event
iii. Step 3 – Click on the table button (view data)
iv. Step 4 – Copy the link in ‘Source Link Clean’ column and paste it in a browser to access
d. Using the dashboard filter
i. The dashboard filter is available to help view specific categories of data. Please click on the respective box and select anything that applies to help you narrow down the data that you are searching for.
ii. As for the date box, you may drag the data slider to adjust the duration of month(s) and year(s) to narrow down your time period. Alternatively, you may manually select the date that applies by clicking on the calendar control to fill in your date selection.
3. Navigating the map (mobile)
a. Moving the map
i. By using your finger: Use two fingers to navigate the map and to hover to the desired location on the map. Drag your fingers apart to zoom in, and bring them together to zoom out.
b. Viewing the tooltip
i. Click on a respective dot to view the tooltip. Each dot shows a single event according to their location on the map.
c. Checking the source link
i. Step 1 – Navigate to the desired point by dragging along the map with two fingers.
ii. Step 2 – Tap on the point of interest.
iii. Step 3 – Click on the table button (view data) at the bottom of the tooltip. A pop-up window will open.
iv. Step 4 – Click ‘Download’ at the top of the pop-up window to download a local copy of the selected data point. The source links can be accessed from the downloaded file.
Optional: Data for multiple cases can be downloaded in one file by highlighting the desired data points on the map, and repeating steps 3 and 4.
d. Using the dashboard filter
i. The dashboard filter is available to help view specific categories of data. Please click on the respective box and select applicable fields to help you narrow down the data that you are searching for.
ii. As for the date box, you may drag the data slider to adjust the duration of month(s) and year(s) to narrow down your time period. Alternatively, you may manually select the date that applies by clicking on the calendar control to fill in your date selection.